Did you know, that it is perfectly possible to check your site speed using just your web browser? I have been using this method to check the speed for quite a while now, but more recently there is even more you can do.
I’m talking specifically about the Chrome browser app. If you don’t use it for normal web browsing you could have it on hand to check your website. It’s fine of course to have more than one browser on your computer.
It’s worth noting that you can’t do this on a tablet or mobile. You will need to log onto your laptop or desktop computer.
In this article, I am going to show you two ways that the Chrome browser can help you to test out the speed of any page on your site.
1. Check your speed using the Network tab of Chrome developer tools
- Open up the Chrome browser app on your laptop or desktop computer
- Go to the web page you want to test. Note this doesn’t have to be the home page, it can be a blog post or a landing page.
- Open up the Chrome browser developer tools panel by right-clicking and then selecting Inspect, or press CTRL+SHIFT+I (or CMD on a Mac).
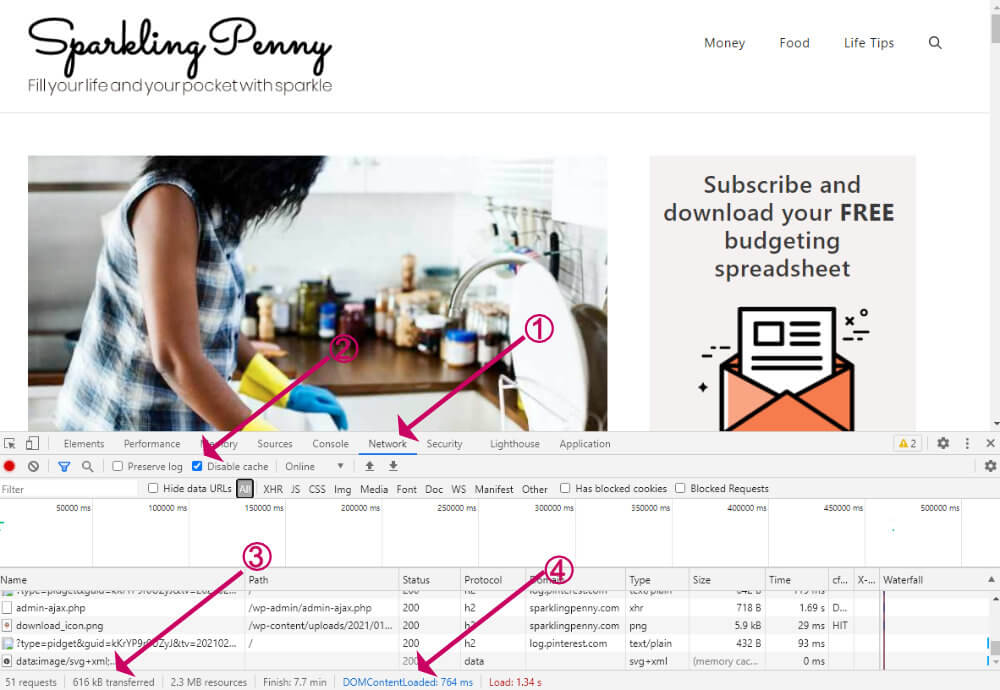
- Click on the Network tab.
- Click the Disable Cache box to simulate a new person coming to your website.
- Reload the page (CTRL/CMD+R)

At the very bottom, you will see the number of kilobytes transferred (3) and on the right the DOMContentLoaded time (4). These are the most important metrics to bring down.
The finish time will depend on what scripts you have running on the page. If those scripts are loaded at the end they won’t affect the time it takes to paint the page, so that figure isn’t so important. If you have ads on your site, Google Analytics or Facebook pixel tracking, that figure will be considerably higher than the DOMContentLoaded time.
Further down this article, I have some suggestions to help improve those numbers.
The method we talked about here will only test the site speed from your own location. For me, that isn’t completely accurate because I am in the UK, whereas most of my site visitors are many miles away from me.
Read on to find out how you can get a more complete report of your site speed with Chrome developer tools.
2. Check your speed using the Lighthouse tab of Chrome developer tools
Lighthouse is a tool developed by Google. Besides measuring speed it will also give you reports on SEO, accessibility and progressive web apps. You can run these test on mobile or desktop.
For this tutorial we will focus on the performance report.
- Open a new Incognito window in the Chrome browser app (SHIFT+CTRL+N). Or, from the options (three dots on the right) choose New Incognito Window.
- Go to the web page you want to test. Note this doesn’t have to be the home page, it can be a blog post or a landing page.
- Open up the Chrome browser developer tools panel by right-clicking and then selecting Inspect, or press CTRL+SHIFT+I (or CMD on a Mac).
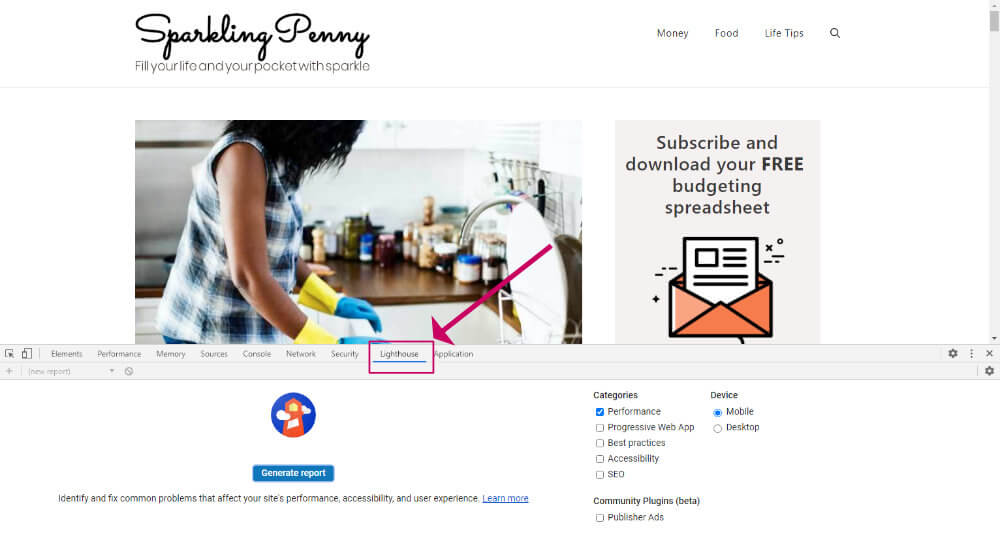
- Click on the Lighthouse tab.

- Now, click on Performance and choose Mobile or Desktop
- Click on Generate report

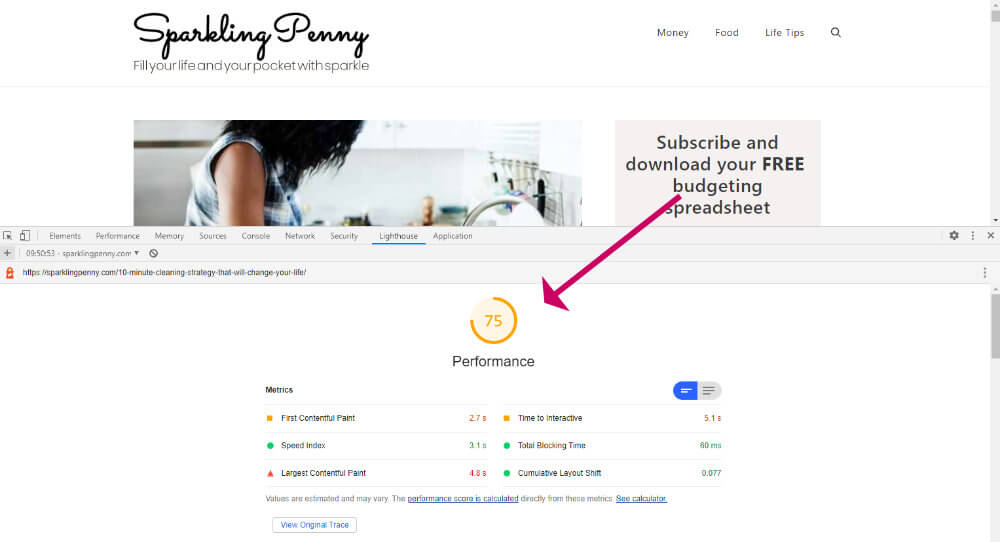
You will then get a colour-coded score out of 100 (where 100 is the best and 1 is the worst), and a breakdown underneath.
Here are a couple things to consider:
- You are unlikely to get a perfect score on either device, especially on mobile.
The mobile score is calculated by throttling, which is an attempt to simulate the experience you would get on a 3G mobile connection, and will always be slower than broadband.
- The score might be different each time.
I have found the score to vary over time. So it is best to run a few tests to get an average score.
3. Other ways to check your site speed
1. Check your speed using the Network tab of Chrome developer tools
GTMetrix is a personal favourite of mine for testing out site speed. I like it because you can run a test from more than one location. Plus, the score appears to be more in keeping with the actual experience I get when loading a web page, as opposed to Google’s more conservative score.
2. Check your speed using the Lighthouse tab of Chrome developer tools
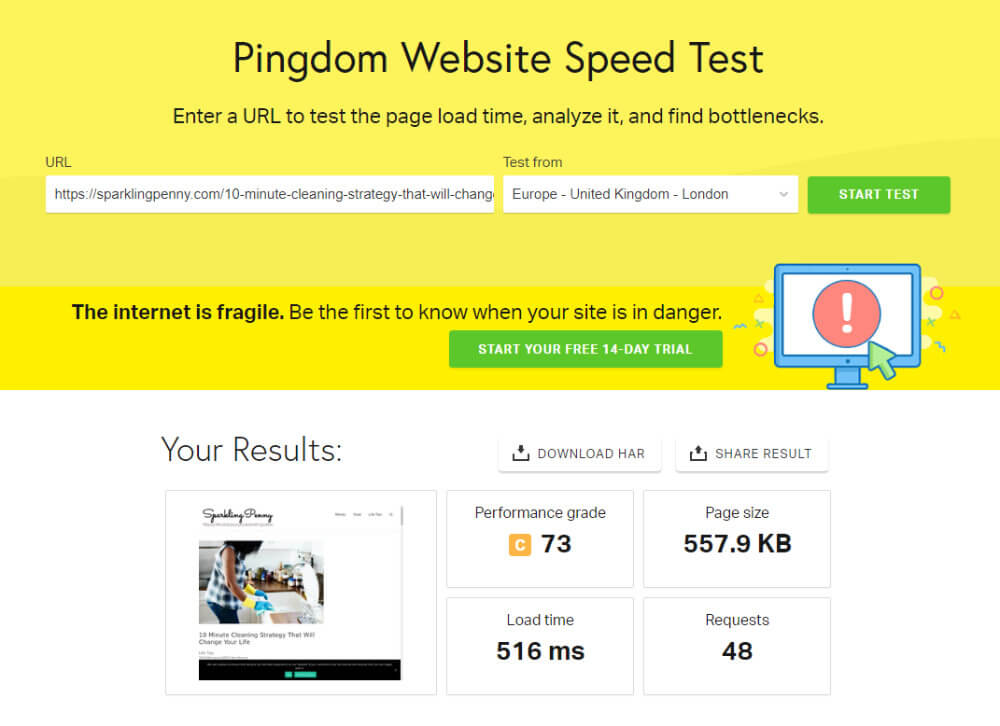
Pingdom Tools also allows you to run a test from a particular location and it will give you a grade from A to F.

What you can do now to improve your site speed
If you are getting a low score. Here are some things you can do right now to improve your site speed.
- Install a caching plugin such as WPRocket.
- Install an image compression plugin such as ShortPixel or TinyPng and run a bulk compression.
- Use a lightweight theme such as GeneratePress.
- Ditch page builder plugins and use Gutenberg instead along with GenerateBlocks.
- Get better hosting such as Siteground or Cloudways.
- Use a CDN to deliver images, CSS and scripts such as Cloudflare.
Final thoughts on how to check your site speed with Chrome Browser developer tools
It’s important you get your site speed as fast as possible. The Chrome Developer tools allow you to keep a constant eye on it. You don’t need to spend a lot of money to get a fast site, it is perfectly possible to get a super-fast site by being careful with your image sizes, choosing a lightweight theme and not over-using page builder plugins. My example site (sparklingpenny.com) runs on the cheapest plan on Cloudways, and it has the GeneratePress theme and some caching. For now, that is good enough to give it very good speed scores.
Do you have any tips for testing your site speed and ways to improve it? Let me know in the comments below.


